Products
Automotive Test Systems
Noise Source Identification
Building Acoustics
Defense Combat Sound Source Localisation
Dynamometers
Material Testing
Microflown Probes
Modal Analysis
Noise and Volume Sources
Noise Modelling Software
Noise Control Solutions
Noise Monitoring Terminal
NVH Test Facilities
Portable Data Acquisition Systems
Sound Level Meters
Sound Quality
Vehicle Data Acquisition Systems
Vibration Meters
Expansion Modules
Facade Noise Map
Single point calculation, which independently arranges the immission locations on the selected facades according to various criteria. Graphical representation of the facade levels (colour marks, exceeded facades, coloured buildings …) and the results, which were further processed with the integrated spreadsheet. Text output, for example the immission location number or the level.

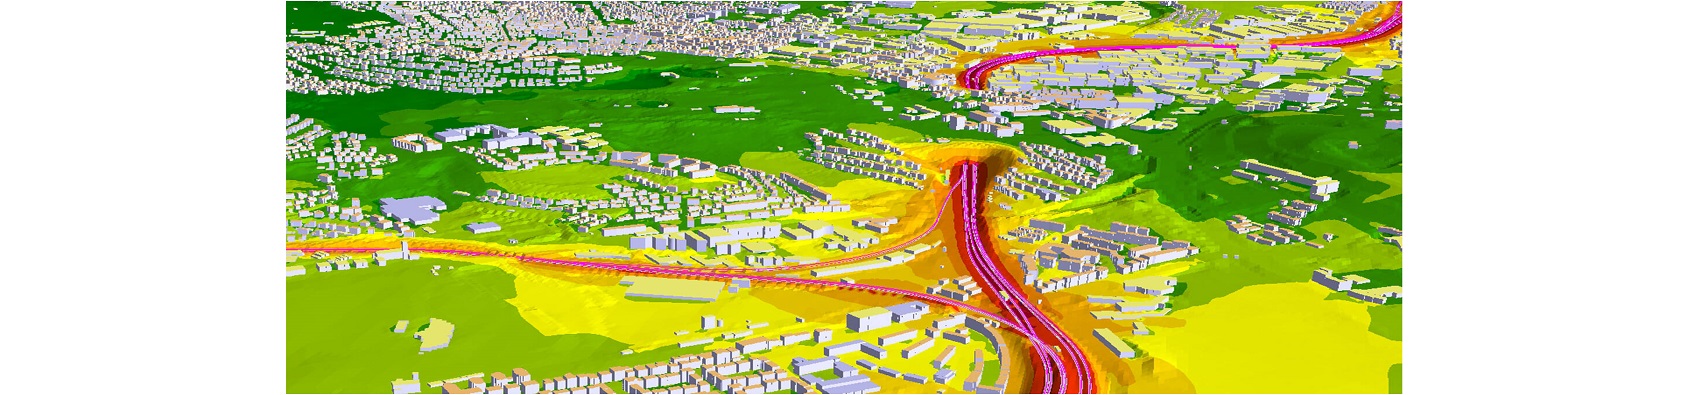
Grid Noise Map
- Calculation of an immission grid at a user-defined height above ground. The grid width can be chosen arbitrarily.
- Display as isophone map with isoline labeling or grid map, also with color gradient.
- Output of difference maps and other arithmetic links, for example sum maps, maximum value maps or addition of constant values or levels.
- Freely definable color scale for graphic output, for intervals or discrete colors (for isolines) by different scale types.
- color intervals – also non-linear, e.g. to highlight limits of different uses.
- Output of the sum level or individual frequencies and groups.