Products
Sound Quality
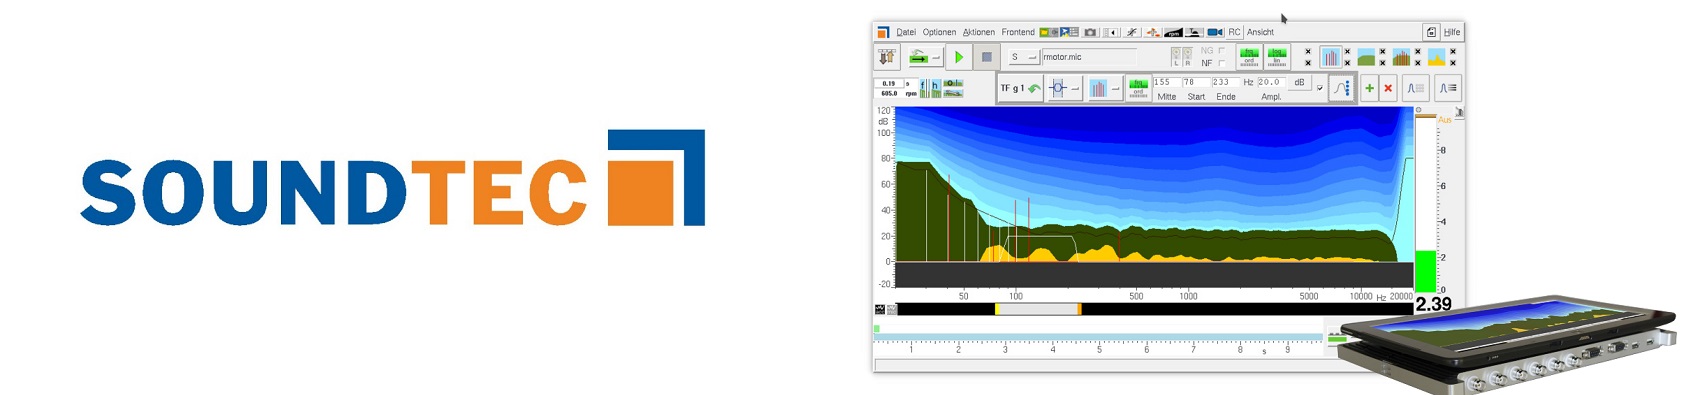
siVision
Integrated analysis, filtering and noise rating
To view all the sound components recognized by the human ear the real time software siVision may be used. It is the only tool which shows all relevant components directly to the operator. siVision provides an automatic decomposition into the relevant sound features for display and filtering. Using the filters, the analysis can be verified directly and a sound design is possible instantly. No other tool provides comparable techniques for the analysis and filtering of sound.
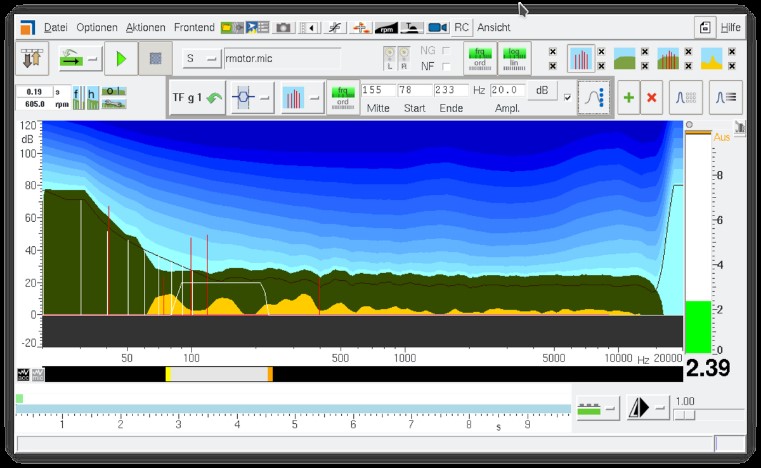
Every sound component which is shown in siVision can be modified and the change will be heard immediately. The siVision Display consists of multiple curves to show all the relevant components for a complete analysis of the sound. These components are
- Tones: narrow band components perceived as tones (red vertical lines)
- Modulations: rattle, squeezing or rough components which often give a unique character to each noise source (yellow areas).
- Noise / Background: the stochastic energy as it is distributed at the different frequency ranges (green area).
- Curves of equal loudness for the tonal components: These are horizons of blue curves showing the levels at which a tonal component will be perceived as equal loud in the presence of the actual noise level versus frequency.
- Limit curves: They are defined by the user as thresholds for the accepted level of each sound component in acoustic testing. They are used in the production test for Ok/ Not Good decisions.
siVision allows for the real time analysis of sound qualities or for the sound comparison of multiple recordings during playback. The acoustic propertied of a machine can be documented and objectively measured in all qualities of the sound as well as compared subjectively.